cascoda-sdk
Segger J-Link Debug Guide
The SEGGER J-Link is the recommended tool for debugging baremetal applications created using the Cascoda SDK. The SEGGER J-Link has good integration to gdb, using a ‘GDB Server’ program to bridge the hardware to the gdb tool.
Software Requirements:
- A version of GDB that supports the target (For Chili2, can be arm-none-eabi-gdb or gdb-multiarch). See the development environment setup guide.
- The latest SEGGER J-Link Software & Documentation Pack
- Can be run on Windows, macOS or Linux
Hardware Requirements:
- A suitable SEGGER J-Link
- An adapter from the 20-pin JTAG to 9-pin or 10-pin swd connector
- The target platform (This guide assumes Chili2D)
Procedure
- Connect J-Link to Chili2D via debug adapter
- Power the Chili2D
- Connect the J-Link to the the host PC
- Run the SEGGER J-Link GDB Server
- Set the target device (M2351… For Chili2, NANO120… for Chili1)
- Set the target interface to SWD
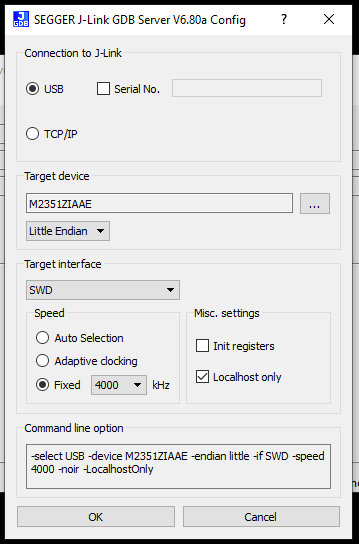
- Click OK, the JLink should connect to the target
- Check the log presented, it should print the port (usually 2331).
Connecting to J-Link...
J-Link is connected.
Firmware: J-Link V10 compiled Jun  9 2020 13:38:07
Hardware: V10.10
S/N: xxxxxxxx
Feature(s): GDB
Checking target voltage...
Target voltage: 3.28 V
Listening on TCP/IP port 2331
Connecting to target...
Connected to target
Waiting for GDB connection...
- Start GDB in the build directory with the command (substitute arm-none-eabi-gdb with gdb-multiarch if necessary, and reference the target binary instead of mac-dongle)
arm-none-eabi-gdb -ex "target remote localhost:2331" bin/mac-dongle
- Use the
monitor resetcommand to reset the target. Other useful commands:
| Command | Effect |
|---|---|
| load | Download the binary onto device flash |
| monitor reset | Reset and halt the target device |
| c | Continue a halted device |
| b |
Set a breakpoint at the location (can be function name, filename:linenum, and more) |
| p |
Print the value of a symbol (can also use other forms like p/x to print in hexadecimal) |
| x |
Examine the memory values at an address (can also use other forms like x/10xb to print 10 bytes in hex) |
GDB is a very powerful tool, there are many guides on the internet that will provide more detail, including the GDB documentation itself.